The NATASHA series are our Liquid Transients (Surge Analysis, Waterhammer Analysis) programs. NATASHA handles pipeline and network models (1 or more sources, 1 or more sinks and 0 or more loops) of up to 40 pipes. NATASHA PLUS handles pipeline and network models (1 or more sources, 1 or more sinks and 0 or more loops) of up to 250 pipes.
NATASHA PLUS also allows multiple Batches, Drag Reduction, Line Sizing and Pressure Calibration via Viscosity or Roughness.
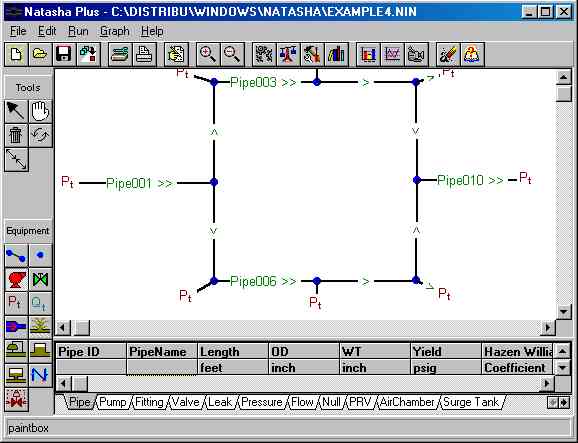
The NATASHA series has a sizeable split-screen (the top part for “drawing” the model diagram and the bottom part for spreadsheet-like data input) interface with various buttons (e.g., Open File, Run Steady-State, Run Transient, Output Static Graphs, Output Animated Graph, Draw Pipe, Zoom, Add Pump, add Valve, etc) in the margins.
New file, Open existing file, Save file, Merge current file with another existing file, Setup printer, Zoom in on diagram, Zoom out from diagram, List last-run output file, Graph calculated heads vs. distance, Graph calculated pressures and flows vs. time, Dynamic Animation Playback of calculated heads vs. distance, Refresh diagram window, Help, Select item in diagram, Move node and connected pipes, Move entire diagram, Delete item in diagram, Reverse flow direction in pipe, Split pipe, MainLine tool and Edit Preferences.
Pipes, Null nodes, Valves, Pumps, Fittings, Pressure Relief Valves (PRVs, these
are actually Surge Relief Valves), Leaks, Check Valves, Source/Delivery
Pressures (time dependent or constant) and Source/Delivery Flows (time dependent
or constant).
English or S.I.
Dynamic Animation Playback (DAP): This option allows you to see the results (hydraulic gradeline, elevation profile, MAOP's) after the Transient Run. You can speed up, slow down, or 'freeze' the Playback and even run it backwards or play it over and over again in a loop. This DAP feature is very useful as it lets you see if PRVs, Check Valves, etc are working properly and if there are any problem areas (e.g.., where pressures exceed the MAOP's). DAP also aids the user in checking input. For example, a mis-match in elevation, where the downstream end of one pipe adjoins the upstream end of another pipe, will result in a false transient. This will show up in DAP most readily if the user runs the Transient simulation for several time steps before any real transients are initiated.
GPT Plots: Pressure and Flow at any node in the system may be displayed graphically as functions of time.
GPX Plots: Elevations, MAOP's, MAXimum CALCulated heads and Calculated Heads at selected Times may be displayed graphically as functions of distance along the mainline or any linear sequence of pipes.
An User’s Manual pdf file that includes the License Agreement, Program Installation, Input and use of the Interface, Output, Examples, Theory and References.